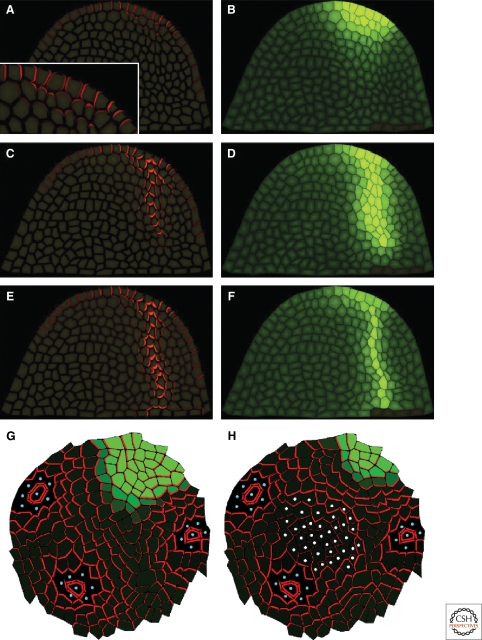
Figure 4.
Examples of auxin transport models in the SAM. (A,C,E) PIN1 localization (red) at different stages of primordia specification followed by provascular vein formation. (B,D,F) Auxin concentration in cells (green) at times corresponding to A, C, E. From the model of Bayer et al. (Bayer et al. 2009) (adapted by permission from CSHL Press). (G,H) Model by Stoma et al. (Stoma et al. 2008) showing PIN distribution obtained in simulation initialized from experimental data. Blue dots mark existing primordia acting as auxin sinks. (H) Shows the importance of a central region (white dots). Degradation of auxin in the central region gives a PIN polarization much more closely corresponding to experimentally observed polarization.

