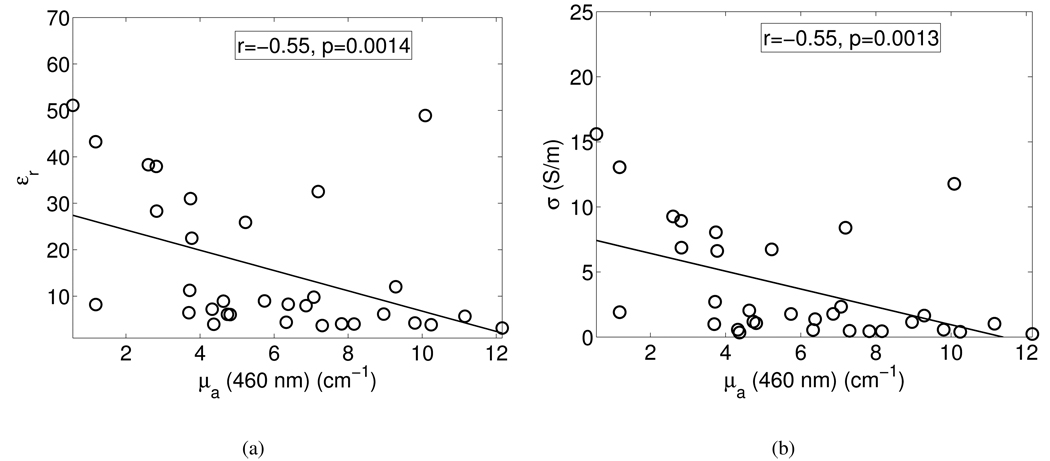
Fig. 2.
Correlations between the absorption coefficient at 460 nm and (a) dielectric constant at 10 GHz, and (b) effective conductivity at 10 GHz. Symbols: raw data points, solid lines: linear fits through the scatter plots. The boxes show the correlation coefficients and p-values for the correlations.

