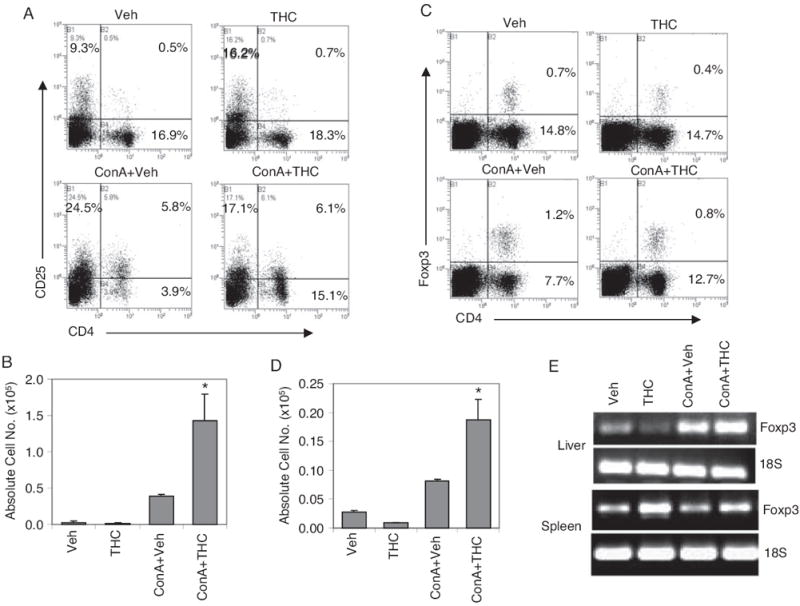
Fig. 5.

Analysis of regulatory T cells in liver. Hepatitis was induced in mice using ConA as described in Fig. 1. Twelve hours after ConA injection, liver MNCs were analyzed for CD4+CD25+ and CD4+Foxp3+ T cells by double staining. Representative flow profiles with percentage of cell population for each treatment group are shown (A and C) along with absolute cell numbers (B and D). *, p < 0.05 compared with ConA + vehicle. E, 4 h after ConA injection, spleens and livers were collected from each group. cDNA was synthesized from total mRNA, and PCR was carried out using gene-specific primers for Foxp3 and 18S genes.
