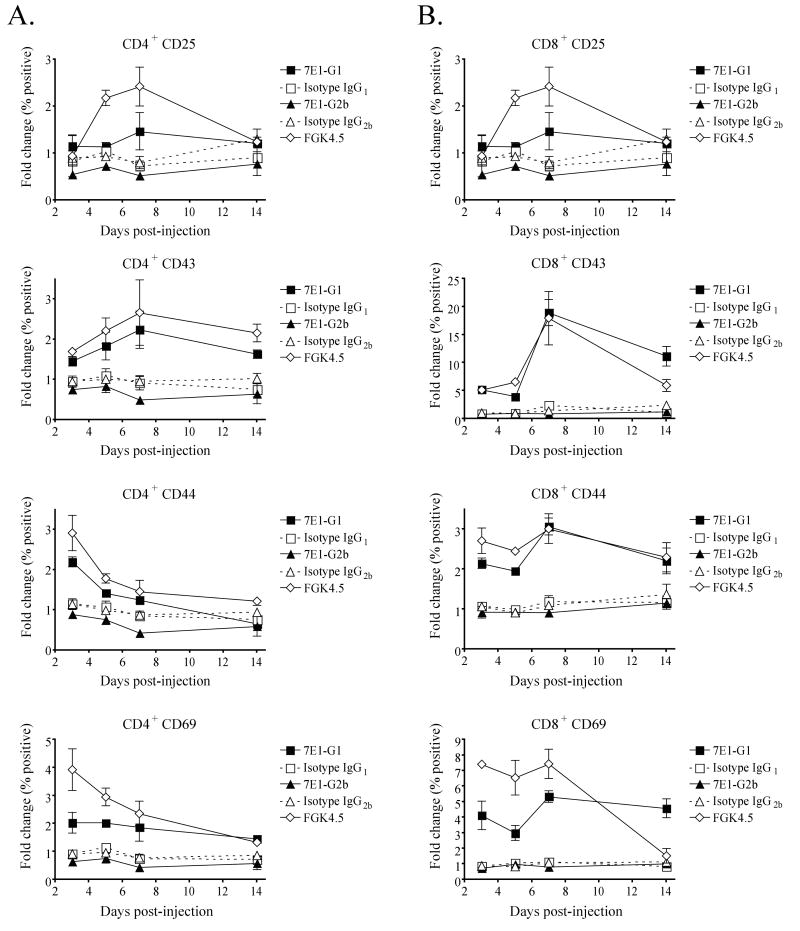
Figure 6. Isotype-specific CD40 agonism translates to T cell activation.
C57BL/6 mice were given a single injection with 500 μg of either 7E1-G1, isotype IgG1 control, 7E1-G2b, isotype IgG2b control, FGK4.5 or left untreated. For analysis of (A) CD4+ T cells and (B) CD8+ T cells, animals were sacrificed after 3, 5, 7 and 14 days and stained for the indicated markers. The expression is displayed as a fold change of the percentage of positive cells compared to untreated animals. These data are representative examples of three independent experiments with three mice per group.

