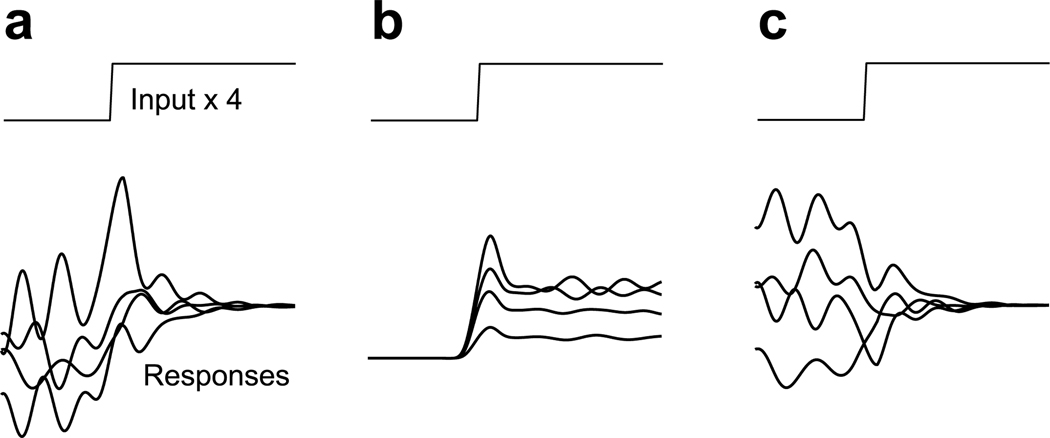
Figure 1.
Schematic illustration of possible types of across-trial firing rate variability. In each panel, we suppose that the same stimulus is delivered four times (four trials) yielding four different responses. Panels a and b were constructed to have the same mean response across the four trials. a. Stimulus-driven decline in variability. b. Stimulus-driven rise in variability. c. Stimulus-driven decline in variability with little change in mean rate.

