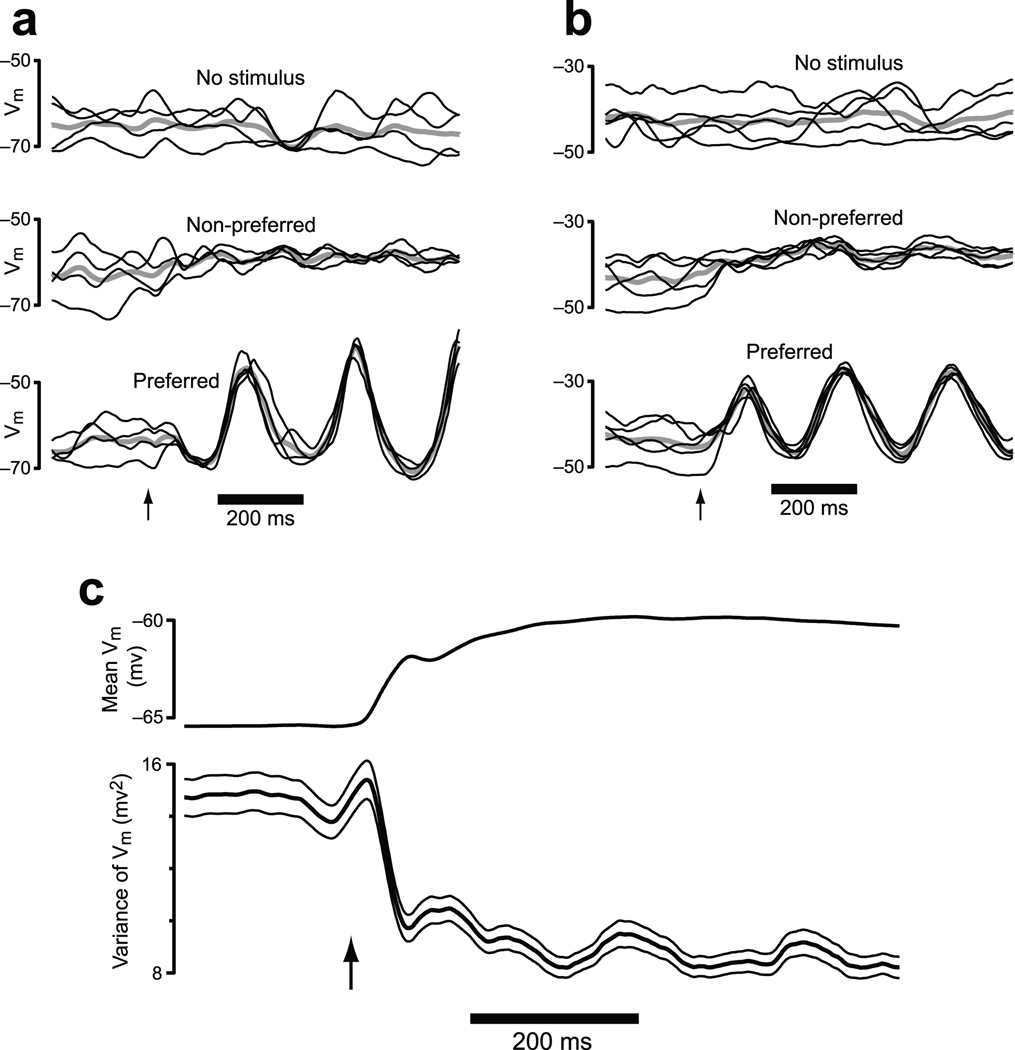
Figure 2.
Analysis of intracellularly-recorded membrane potential from cat V1. Stimuli were drifting sine-wave gratings presented at different orientations / frequencies. Analysis employed a 50 ms sliding window (box filter) to match the 50 ms window used for the FF analysis. Similar results were obtained with a shorter (5 ms) or longer (100 ms) window. a. Data from one example neuron. Vm for individual trials (black) is plotted on top of the mean (gray). Data are shown when no stimulus was delivered, for a non-preferred stimulus, and for a preferred stimulus. The arrow marks stimulus onset. b. Similar plot for a second example neuron. c. The mean and variance of Vm across all 52 neurons and all stimuli. Flanking traces give SEMs.

