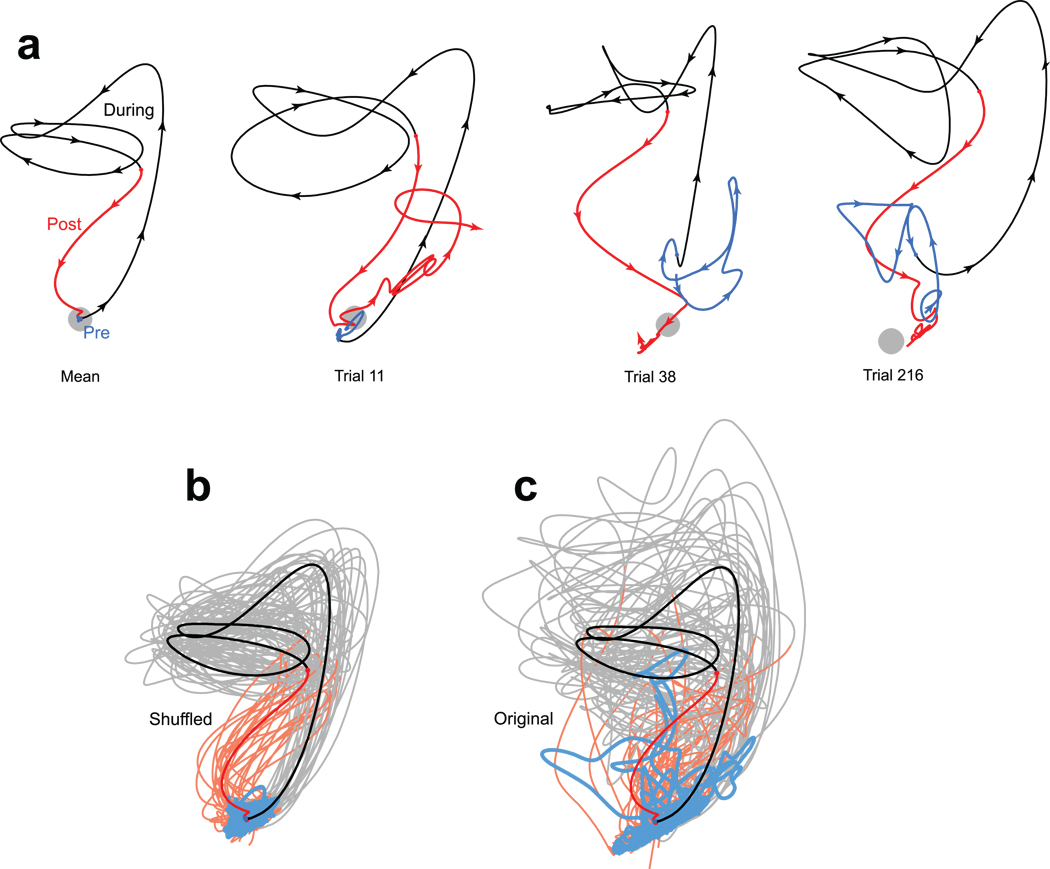
Figure 8.
Projections of V1 activity into a 2-dimensional space. Blue, black and red traces show activity before, during and after stimulus presentation (a drifting 45° grating). Same dataset as Figure 6c. a. The mean trajectory and three trials picked by hand. The grey spot shows the average location of pre-stimulus activity. In a few cases (e.g., upper left portion of the rightmost panel), traces were moved very slightly apart to make it clear that they traveled in parallel rather than crossed. b. Trajectories after data were shuffled to remove correlated variability. 25 randomly-selected trials are plotted (lighter traces) along with the mean (saturated traces). c. Same as in b, but for the original unshuffled data.

