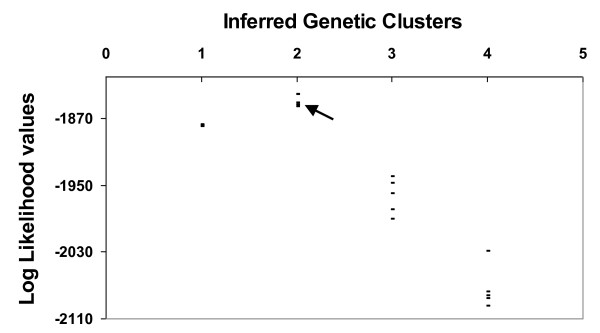
Figure 3.
Inference of genetic clusters (K) from Ctenomys australis sampling sites of Necochea (Argentina). The log-likelihood values (points) based on the STRUCTURE algorithm, for each 6 independent runs to the whole data set (n = 112) are also shown. The black arrow shows the best clustering solution.

