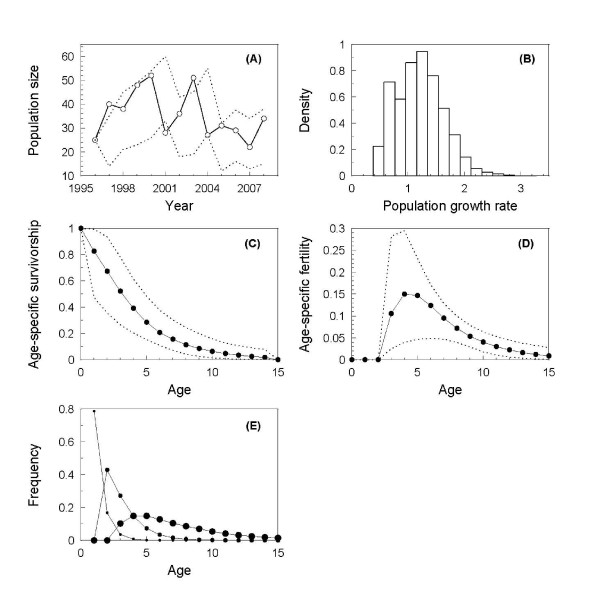
Figure 2.
Summary of the fitted demographic model. (A) Observed female population size (open dots and solid line) and 95% confidence limit from the simulated population process (dotted line). (B) Frequency histogram of 1,000 rounds of the simulated population growth rate (calculated for each time step, i.e. 12 values for each simulation round). (C) Age-spefic survivorship and (D) fertility (medians denoted with solid line and filled dots, 95% confidence limit shown by dotted line) calculated from the transition matrix parameterised by sampling 1,000 combinations of parameter values from the last 5,000 posterior chains. (E) Age-within-stage distributions (the three stages are marked with small, medium and large dots for J2, S and A, respectively). These are scaled to proportions of individuals expected to be of a given age in each stage.

