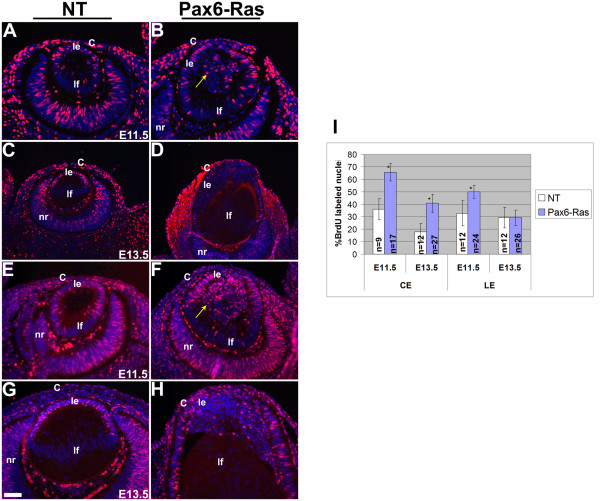
Figure 4.
Cell proliferation in Ras transgenic mice. BrdU (A-D) and Ki67 (E-H) immunohistochemistry was performed on nontransgenic (NT) (A, C, E, G) and Pax6-Ras transgenic (B, D, F, H) embryos of age E11.5 (A, B, E, F) and E13.5 (C, D, G, H). Antigen antibody complexes are in red and nuclei are stained blue with DAPI. Quantification of the BrdU proliferation index is shown in panel I. Ras transgenic lens epithelial cells showed a significant increase in BrdU incorporation at E11.5 (I) but not at E13.5 (I). The number of sections counted for each genotype and time point are indicated in the graph. Error bars indicate standard deviation. Asterisk in the graph indicates a significance of P < 0.05. The scale bar (G) represents 50 μm in panels A, B, E-H and 100 μm in panels C, D.

