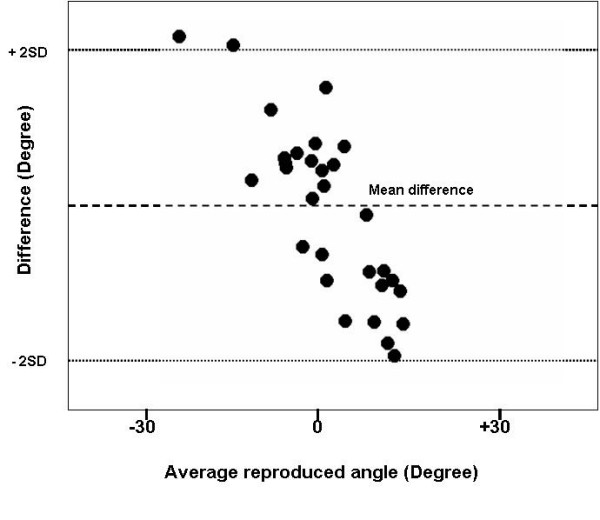
Figure 4.

Bland-Altman graph of skin mounted sensor. The dashed line represents the mean difference (-2°) between the skin and manipulandum placement of the sensor in active condition. The dotted lines represent 2 standard deviations (SD) (+2 and -6°).
