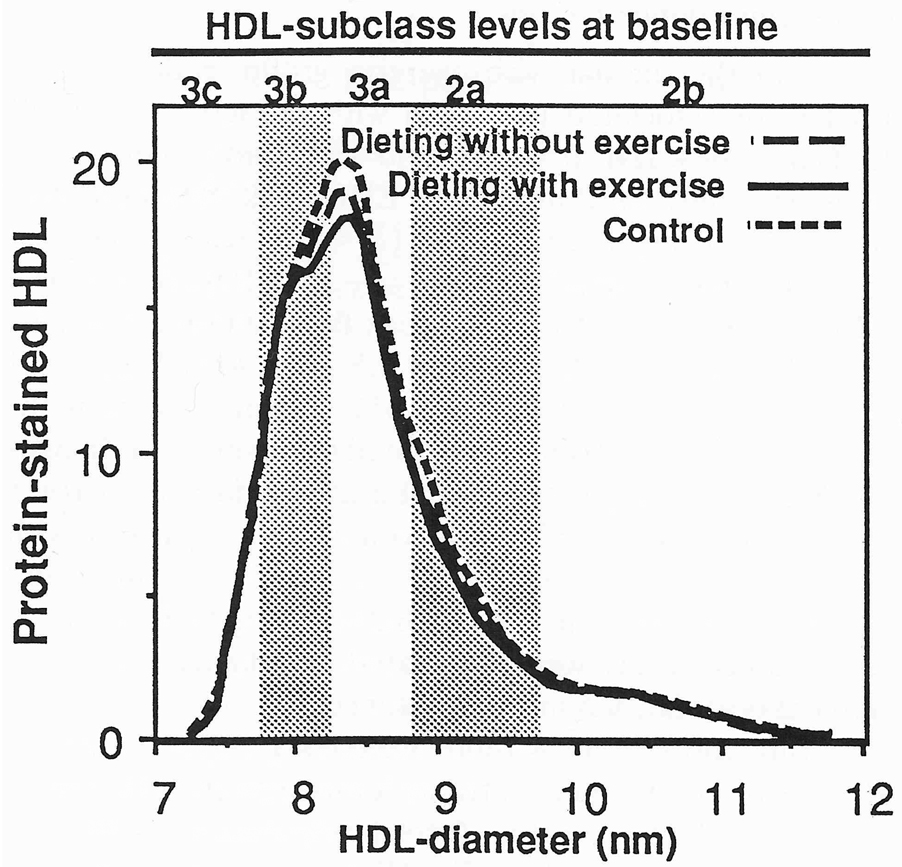
Fig 1.
Baseline levels of protein-stained HDL from nondenaturing polyacrylamide gradient gel electrophoresis in men. The levels of the curves were determined by averaging individual values at each diameter value for the 37 men of the dieting with exercise group, 39 men of the dieting without exercise running group, and 40 controls. Men who both ran and dieted had significantly higher HDL between 8.2 and 8.32 nm than controls. The subfraction intervals defined by Blanche et al [21] are provided for reference.

