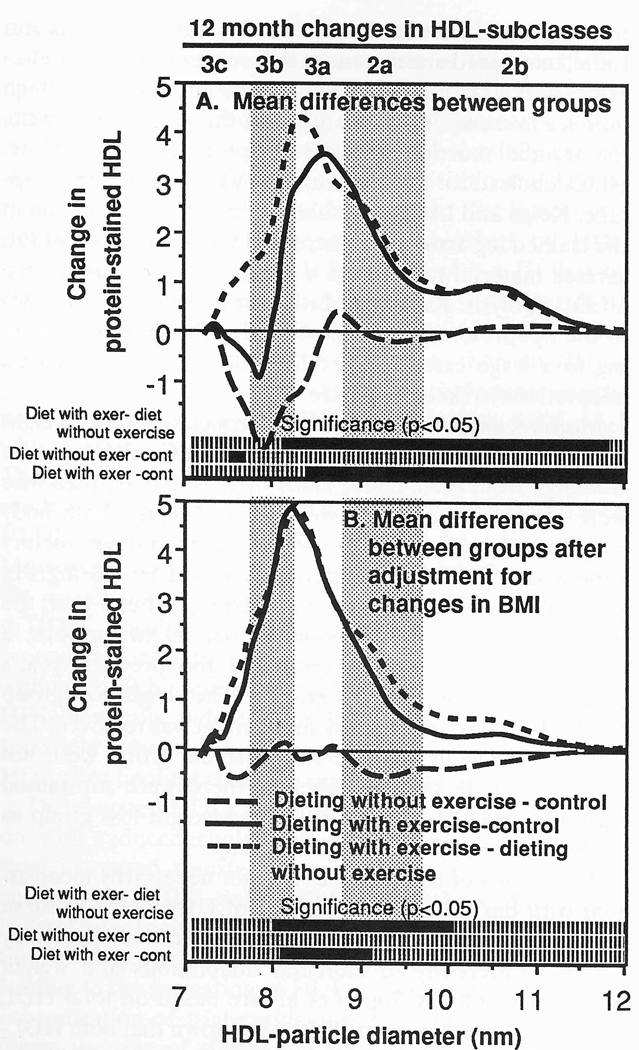
Fig 3.
Mean differences for changes in protein-stained HDL by particle diameter between the dieting with exercise, dieting without exercise, and control groups. Results are displayed (A) before and (B) after adjustment for change in BMI. Bars at the bottom of the figures designate significance at P < .05 by two-sample t tests (A) and analysis of covariance (B).

