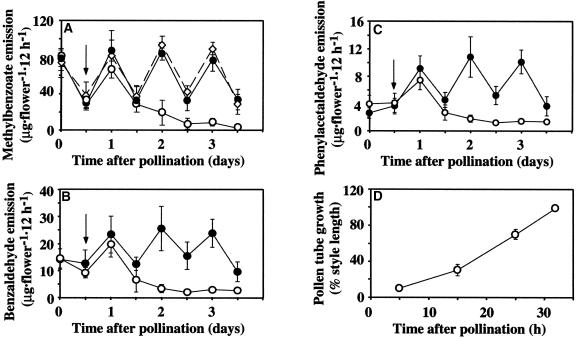
Figure 2.
Effect of Pollination on Floral Scent Emission and Pollen Tube Movement in Petunia Flowers.
(A) Emission of methylbenzoate in wild-type and etr1-1 petunia flowers pollinated with self pollen on the night of day 2 after anthesis.
(B) and (C) Emission of benzaldehyde (B) and phenylacetaldehyde (C) in wild-type petunia flowers pollinated with self pollen on the night of day 2 after anthesis. Increases in the amount of benzaldehyde and phenylacetaldehyde at 1 day after pollination relative to the emission on the day of pollination reflect developmental changes.
Closed circles represent emission in unpollinated wild-type flowers, and open circles and open diamonds represent emission in pollinated wild-type and etr1-1 flowers, respectively. Arrows indicate the time of pollination. Standard deviations are indicated by vertical bars. Each point is the average of five and six independent scent collections for unpollinated and pollinated wild-type flowers, respectively, and four independent scent collections for etr1-1 flowers.
(D) Pollen tube growth in petunia styles pollinated on the night of day 2 after anthesis. Average style length is 4.15 ± 0.03 cm (n = 30). Three styles were used at each time point. Standard deviations are indicated by vertical bars.

