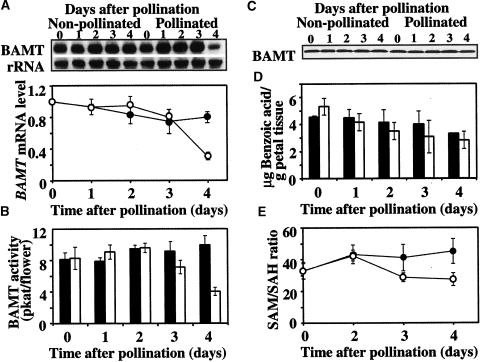
Figure 3.
Effect of Pollination on BAMT Gene Expression, BAMT Activity, the Levels of BAMT Protein and Benzoic Acid, and SAM/SAH Ratio in Snapdragon Flowers Pollinated on Day 5 after Anthesis.
(A) RNA gel blot analysis of steady state BAMT mRNA levels in unpollinated and pollinated snapdragon flowers at different times after pollination. Total RNA was isolated from upper and lower petal lobes of snapdragon flowers pollinated on day 5 after anthesis at the times indicated at top, and 5 μg of total RNA was loaded in each lane. The top gel represents the results of hybridization with a BAMT probe. Autoradiography was performed overnight. The blot was rehybridized with an 18S rDNA probe (bottom gel) to standardize samples. RNA gel blots were scanned with a PhosphorImager, and values were used to generate a graph of fluctuation in relative BAMT mRNA levels after pollination. Each point on the graph is the average of eight independent experiments The transcript level on the day before pollination was taken as 1. Closed and open circles represent transcript levels in unpollinated and pollinated flowers, respectively. Standard error values are indicated by vertical bars.
(B) BAMT activity in unpollinated and pollinated snapdragon flowers at different times after pollination. For each time point, enzyme assays were run in duplicate on at least three independent crude extract preparations for unpollinated and pollinated flowers, and the standard deviations (indicated by vertical bars) were obtained. Closed bars represent BAMT activity in unpollinated flowers, and open bars represent BAMT activity in pollinated flowers.
(C) BAMT protein levels in unpollinated and pollinated snapdragon flowers at different times after pollination. The representative protein gel blot shows the 49-kD protein recognized by anti-BAMT antibodies. Proteins were extracted from upper and lower petal lobes at the times after pollination indicated at top, and 11 μg of protein was loaded in each lane.
(D) Amount of benzoic acid in unpollinated and pollinated snapdragon flowers at different times after pollination. Benzoic acid was extracted from upper and lower petal lobes by supercritical carbon dioxide extraction and analyzed by HPLC. Closed bars represent benzoic acid levels in unpollinated flowers, and open bars represent benzoic acid levels in pollinated flowers. Standard error values are indicated by vertical bars. Each point is the average of three independent experiments.
(E) Levels of the SAM/SAH ratio in unpollinated and pollinated snapdragon flowers at different times after pollination. Closed and open circles represent the SAM/SAH ratio in unpollinated flowers and pollinated flowers, respectively. Standard error values are indicated by vertical bars. Each point is the average of three independent experiments. SAM and SAH levels on the day before pollination were 38.99 ± 4.01 and 1.21 ± 0.14 nmol/g fresh weight, respectively, where ± corresponds to a 95% confidence interval of the mean.

