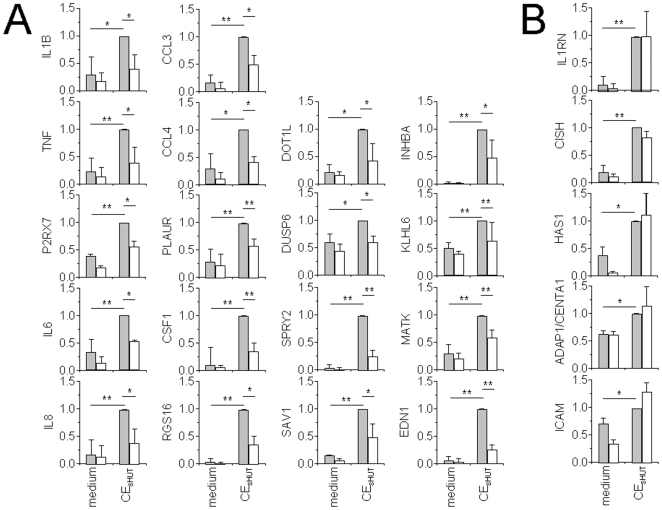
Figure 5. qPCR assessment of selected transcripts to validate microarray results.
Several genes listed in Table S4 were selected and RNA, isolated from the 3 monocyte preparations, was subjected to qPCR. (A) Genes that were validated (i.e., those displaying similar behavior as in microarray analysis). (B) Genes that were not validated. Results were normalized to fully activated condition (CEsHUT), considered to be 1. Data are expressed as mean ± SD, n = 3; ** p<0.01; * p<0.05.

