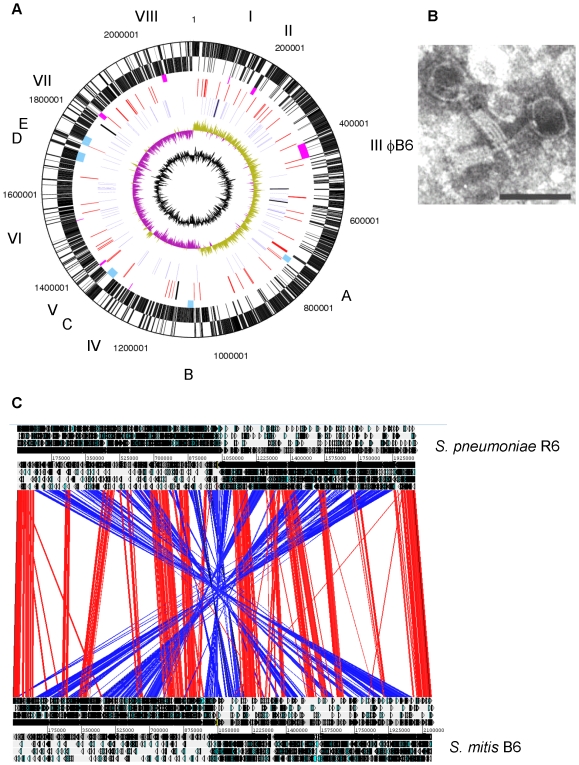
Figure 1. The S. mitis B6 genome.
A. Circular display of the S. mitis B6 chromosome. Black dots mark clusters larger than 15 kb which are absent in most or all S. pneumoniae and S. mitis; open circles indicate phages related islands. The outer two circles show open reading frames oriented in the forward and reverse direction, respectively. The third circle marks phage related elements including φB6 (pink; roman numbers) and gene clusters >15 kb of the accessory genome which are absent in most or all S. pneumoniae and S. mitis (blue; A: ntp cluster; B: unknown function; C: Tn5801; D: monX cluster; E: aminoglycoside resistance). The fourth circle shows IS (red) and the two group II introns (black), the fifth circle BOX elements (blue) and RUP (black). The sixth circle shows GC skew, purple indicating negative values; the sixth circle indicates the G+C content. B. Electron micrograph of φB6. Phage particles were purified from mitomycin C-induced S. mitis B6 cultures (0.2 µg/ml). The bar reprents 100 nm. C. Genome alignment of S. mitis B6 with S. pneumoniae R6. In the display using ACT, red areas mark regions of the same orientation in both species, blue indicates regions implicated in the X-alignment. Only regions >1 kb are shown.

