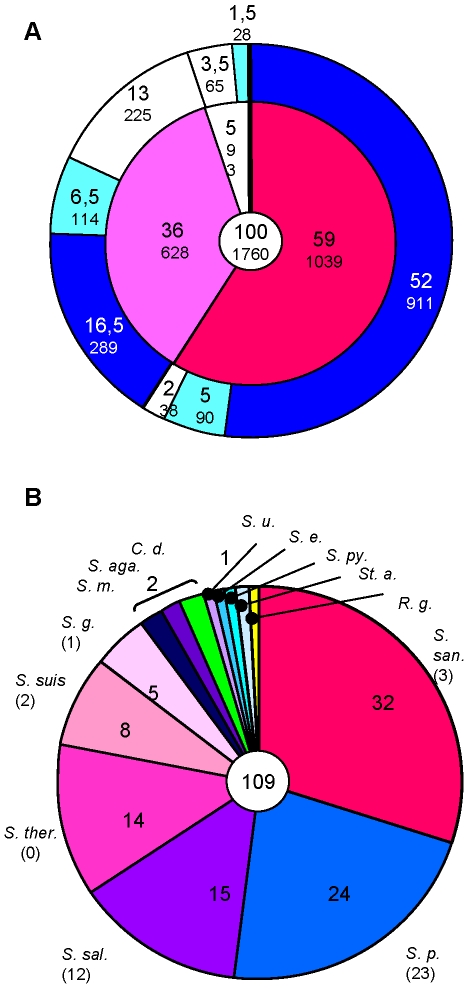
Figure 6. Genomic comparison of S. mitis and S. pneumoniae.
Genes represented on the oligonucleotide microarray (1760 features) excluding mobile elements and phage related gene clusters were used in this calculation. A. Comparison of 1760 S. mitis gene products with those annotated in six S. pneumoniae genomes. S. pneumoniae genomes: see text for details. Inner circle: deep red, percentage of features hybridizing with all ten S. mitis strains (S. mitis core); light red, with at least one S. mitis (S. mitis accessory genome); white: no hybridization with any S. mitis (B6 specific); outer circle: proteins present in six S. pneumoniae genomes according to in silico analysis of the annotated gene products, using 70% identity as cut off value and a 60% minimum coverage. Dark blue: genes present in all six S. pneumoniae genomes; light blue: genes present in at least one S. pneumoniae; white: absent in S. pneumoniae. Large numbers indicate the percentage of the 1760 genes represented on the microarray; the number of genes is given in small letters below. B. Homologues of the 109 S. mitis B6 genes not present in the six S. pneumoniae genomes listed in (A). Only >80% identity values were used, and only species with the best hit are listed. The number in brackets below the species name indicates genes exclusively found in this species. S. aga.: S. agalactiae; S. e.: S. equi; S. g.: S. gordonii; S. m.: S. mutans; S. p.: S. pneumoniae; S. py.: S. pyogenes; S. san.: S. sanguinis; S. therm: S. thermophilus; S. u.: Streptococcus uberis; C.d.: Clostridium difficile; R. g.: Ruminococcus gnavus; St.a.: Staphylococcus aureus.

