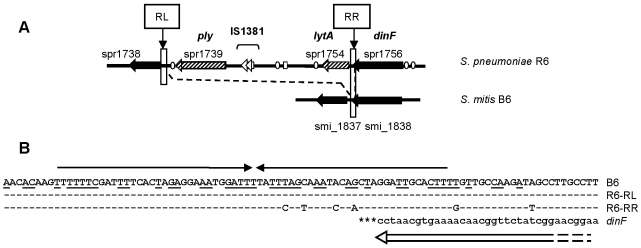
Figure 7. Comparison of the ply/lytA island and flanking regions of S. pneumoniae R6 and the dinF region in S. mitis B6.
A: Black: conserved genes in S. mitis B6 and S. pneumoniae; hatched: S. pneumoniae ply and lytA; ovals: BOX elements; small rectangle: RUP elements; RL and RR designate the left and right direct repeats flanking the ply/lytA region (long rectangles). B: Sequences of the left (RL) and right (RR) direct repeat. Arrows above mark the inverted repeat within the direct repeat sequence, and matching nucleotides are underlined; non conserved nucleotides of the S. pneumoniae R6 sequences compared to S. mitis B6 are shown. The DinF gene is indicated below in small letters and as open arrow.

