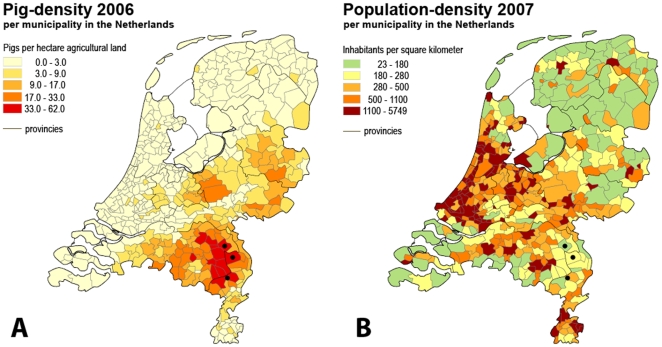
Figure 1. The pig-density and population-density in the Netherlands.
Pig-density is depicted in panel A, population-density is depicted in panel B. The participating municipals of St. Anthonis, Venray and Meijel are indicated with “•”. Source: CBS Statistics Netherlands (www.cbs.nl).

