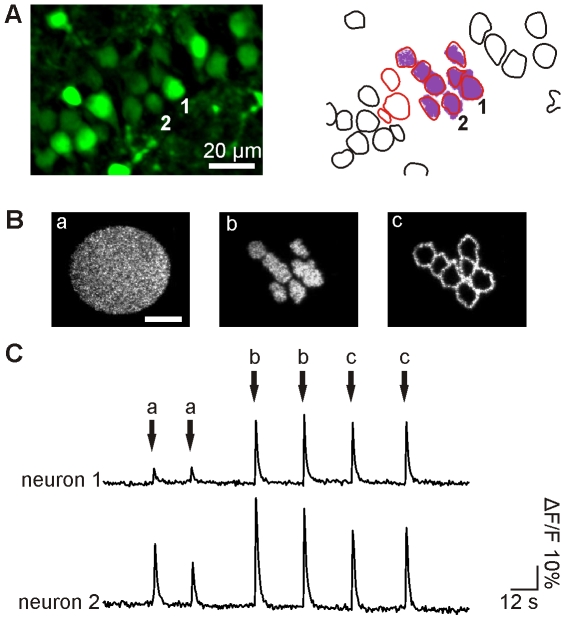
Figure 5. Ca2+ imaging upon holographic photostimulation of multiple neurons.
A. (left) Fluorescence images obtained with HiLo microscopy showing CA1 neurons of a hippocampal slice. (right) Scheme of responding (red) and non-responding (black) cells to photostimulation with a shaped pattern (blue). B. Images of the three patterns used to photostimulate target neurons in CA1 with MNI-glutamate using the same energy of 3.6 µJ, corresponding to 1.7 nJ/µm2, 6.2 nJ/µm2 and 18.1 nJ/µm2 for the elliptic, shaped and anti-shaped patterns, respectively. C. Variation of intracellular Ca2+ concentration of two different target neurons during photostimulation with the three different pattern configurations.

