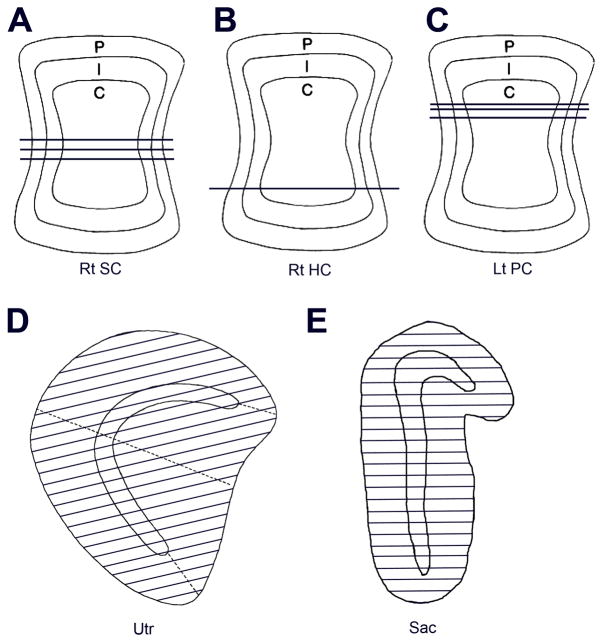
Figure 2.
Samples based on surface reconstructions are shown after transfer to standard drawings. A–C. Thirty-section transverse ultrathin samples in three cristae, each taken from a different animal. Seven samples were analyzed, three in each of two animals (A, C) and one in a third animal (B). Rt SC, Rt HC and Lt PC, right superior, right horizontal and left posterior cristae. D, E. Hair cells were counted in 2-μm transverse sections throughout the utricular (D, Utr) and saccular (E, Sac) maculae. Lines in each drawing spaced 50 μm apart show the sections in a single organ. Samples, each taken from a different labyrinth, were similar in three other utricular and one other saccular organs.

