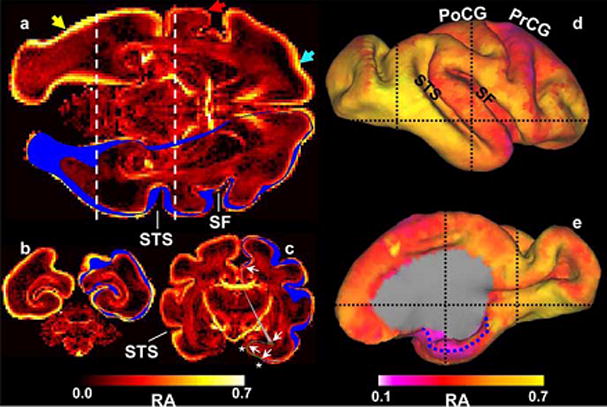
Figure 4.

Heterogeneity in isocortical diffusion anisotropy at E125. In each image plane, the intersection of the right hemisphere isocortical surface is shown in blue. a, Laminar (light blue arrow) and regional (compare regions near yellow and red arrows) patterns of anisotropy variation are observable. Regional variation is also apparent in the coronal views (b, c; positions of these image planes are indicated by dashed lines in a, d, and e). For example, anisotropy caudal/inferior to the STS is larger than rostral/superior to the STS. The dotted blue line in e indicates the medial extent of the parahippocampal gyrus.
