
Fig. 2. Normalized expression levels of 24 genes in the prognostic subgroups.
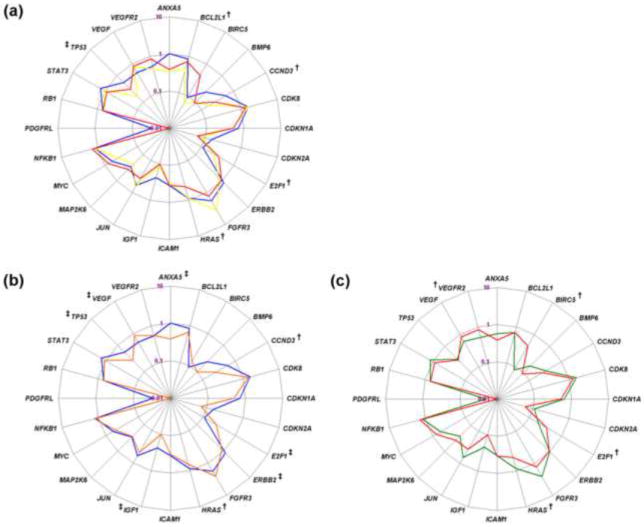
Radar plots show the median relative quantification (ΔΔCt) values of all interrogated genes on a logarithmic scale. Comparisons were made between (a) the individual groups (group 1, blue; group 2, yellow; group 3, red), (b) patients without recurrence (group 1, blue) and with recurrence (groups 2 and 3, orange), and (c) patients without progression (groups 1 and 2, green) and with progression (group 3, red).
†p ≤ 0.050.
‡ 0.050 < p ≤ 0.100.