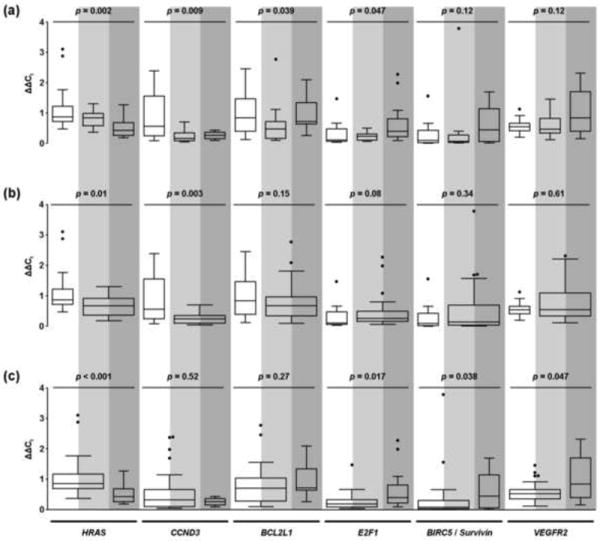
Fig. 3. Distribution of HRAS, CCND3, BCL2L1, E2F1, BIRC5/Survivin, and VEGFR2 relative expression levels in the prognostic subgroups.

The white, light grey, and dark grey areas denote patient groups 1, 2, and 3, respectively. Tukey boxplots for the six genes are shown (a) across each of the individual prognostic subgroups; (b) in patients with no recurrence (group 1, white area) versus patients with recurrence, without or with progression (groups 2 and 3, light and dark grey areas); and (c) in patients with no progression, without or with recurrence (groups 1 and 2, white and light grey areas) versus patients with progression (group 3, dark grey area). The boxes represent median with interquartile range; whiskers go 1.5 times the interquartile distance or to the highest or lowest point, whichever is shorter. Dots represent outliers.
