Figure 1.
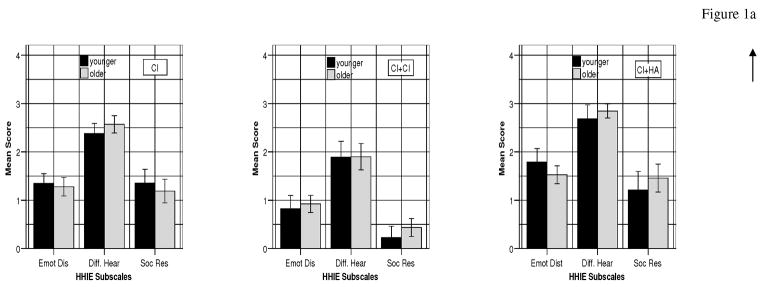
Figure 1a: HHIE subscale scores for CI (Younger n=31; Older n=37), CI+CI (n=13; 23), and CI+HA (n=14; 24) groups.
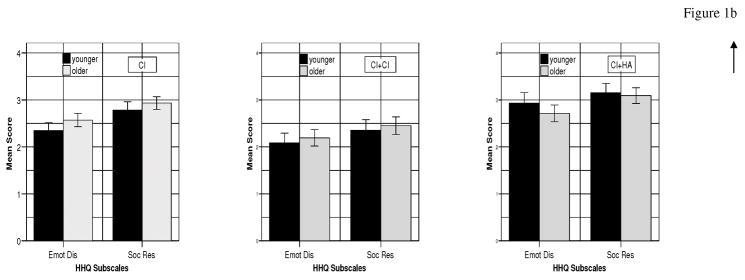
Figure 1b: HHQ subscale scores for CI (Younger n=31; Older =36), CI+CI (n=13; 23), and CI+HA (n=13; 24) groups
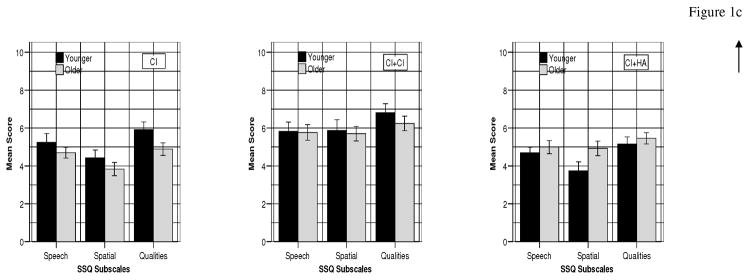
Figure 1c: SSQ subscale scores for CI, CI+CI, and CI+HA groups (sample sizes as for Figure 1a).
Figure 1d: Mean % correct on the speech performance measure (CNC) for CI (Younger n=7; Older n=17), CI+CI (n=9; 18), and CI+HA (n=4; 7) groups: mean error on localization task (RMS) for CI (n=3; 7), CI+CI (n=13; 22) and CI+HA (n=2; 2) groups.


