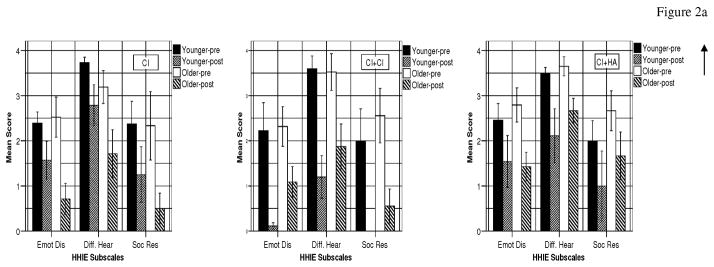
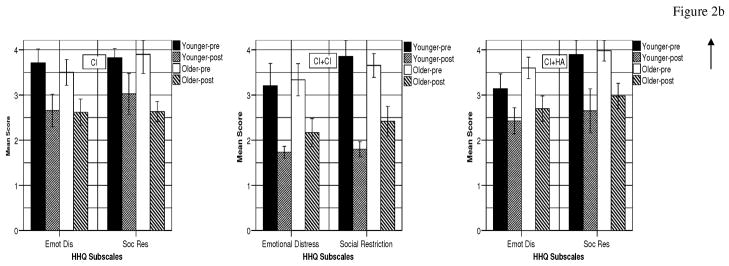
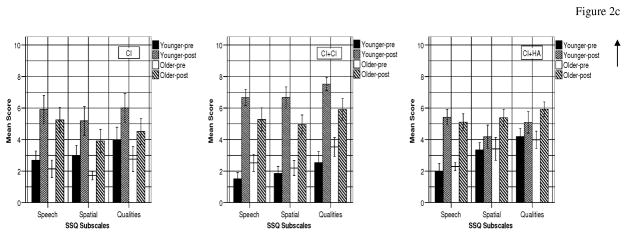
Figure 2.
Figure 2a: Pre-post HHIE subscale scores for CI (Younger n=8; Older n=6), CI+CI (n=5; 9), and CI+HA (n=5; 9) groups.
Figure 2b: Pre-post HHQ subscale scores for CI (Younger n=8; Older n=6), CI+CI (n=7; 11), and CI+HA (n=4; 10) groups.
Figure 2c: Pre-post SSQ subscale scores for CI (n=8; 6), CI+CI (n=8; 10), and CI+HA (n=5; 11) groups.
Figure 2d: Pre-post mean % correct on speech performance measure (CNC) for CI (Younger n=12; Older n=18), CI+CI (n=6; 8), and CI+HA (n=4; 12) groups: pre-post mean error on localization task (RMS) for CIi (n=3; 7), CI+CI (n=7; 5), and CI+HAii (n=0; 2) groups.
iThere are no pre localization scores in the CI group.
iiThere are no younger patients providing pre-post localization scores in the CI+HA group.


