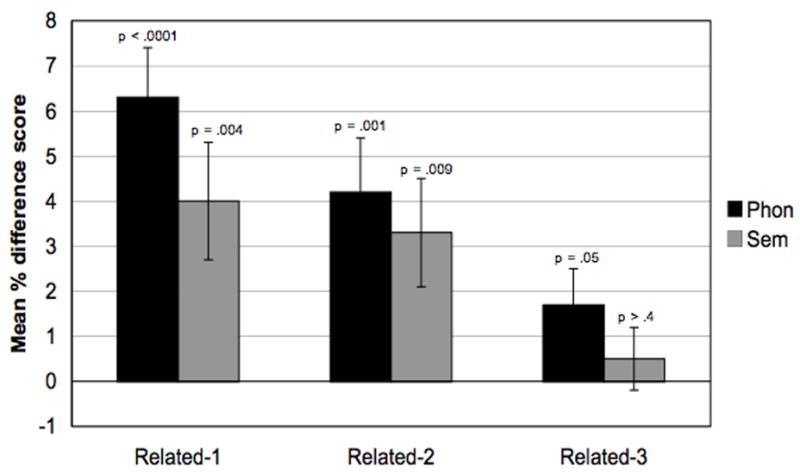
Figure 3.

Mean percent difference scores for the control group are denoted by phonological (black columns) and semantic (gray columns) versions of the item-recognition task, NO trials only. Error bars denote one standard error of the condition mean. The p-values denote where one-sample t-tests revealed the magnitude of interference to be significantly greater than zero.
