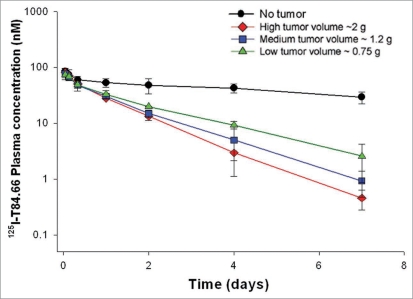
Figure 1.
Comparison of anti-CEeA IigG, 125I-Tt84.66 disposition in control and tumor bearing mice. Solid circles represent plasma 125I-concentration data collected from control mice (no tumor). Solid triangles represent plasma 125I-concentration data collected from low volume tumor bearing mice. Solid squares represent plasma 125I-concentration data collected from medium volume tumor bearing mice. Solid diamonds represent plasma 125I-concentration data collected from high volume tumor bearing mice.

