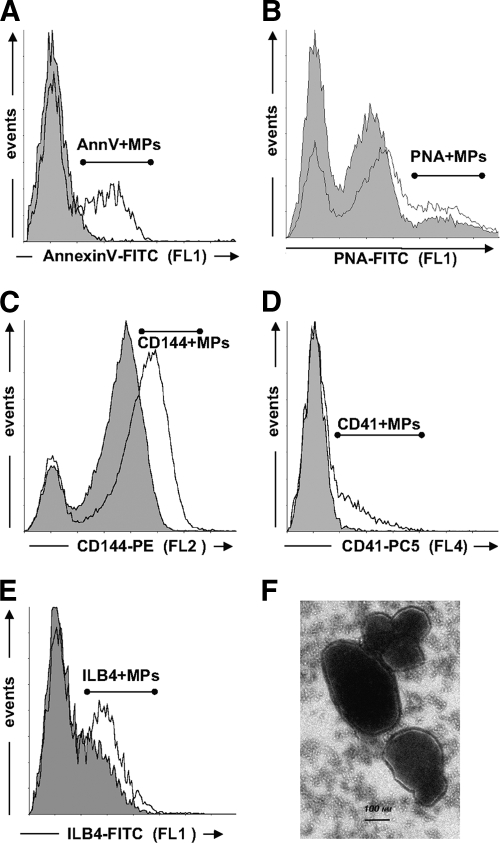
FIG. 1.
Representative traces of flow cytometry analysis of Annexin V+, platelet, endothelial photoreceptor, and microglial microparticles in human vitreous samples. A–E: Size-selected events (0.1–1.0 μm) are plotted as a function of their fluorescence for specific Annexin V–FITC binding (FL1) (A), lectin PNA-FITC labeling (B), anti-human CD144-phycoethrin (PE) labeling (C), anti-human CD41-PC5 labeling (D), or lectin ILB4-FITC labeling (E). Gray-shaded areas represent unspecific labeling determined either in the absence of calcium (A), fluorescent isotypic antibodies (C and D), or d-Galactose (B and E). F: Ultrastructural analyses of vitreous microparticles. Transmission electron microscopic picture of vitreous section showing clustering vitreous vesicles with negative staining. Following samples embedding in Epon 812, thin sections were layed on a carbon-coated grid, stained with 7.6% uranyl acetate and 0.4% lead citrate, and then examined by electron microscopy (Phillips, Eindhoven, the Netherlands; Tecnai, Fei, U.S.). Scale bar: 0.1 μm. FL1, green fluorescence; FL2, orange fluorescence; FL4, infrared fluorescence.

