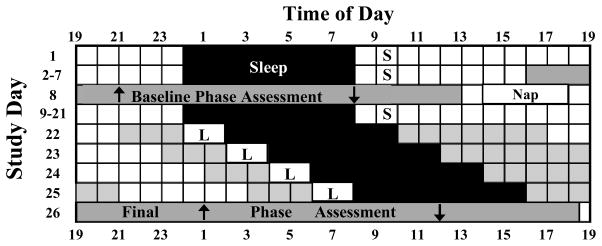
Figure 1.
Diagram illustrating the study protocol. This schedule is an example for a subject sleeping 00:00–08:00 h during the baseline. On days 22–25, the shaded black area indicates when the subject was in bed in the dark in a laboratory bedroom. “S” during baseline indicates the hour during which the subject was required to go outside for at least 10 min of light exposure. Boxes with “L” indicate the 2 h when the subject sat in front of the light box in the laboratory. Grey areas on days 22–25 indicate times when the subject was required to be in the laboratory (< 60 lux). Upward arrows indicate a typical time of the DLMO. Downward arrows indicate the time of the DLMOff.

