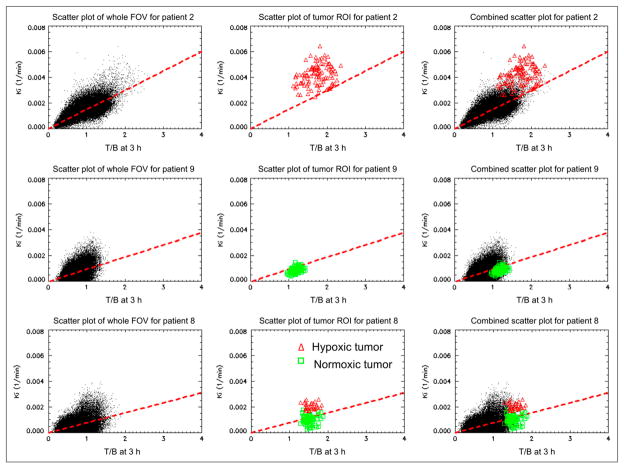
FIGURE 6.
Scatter plots of individual voxels (T/B, Ki) at both whole head and neck region and tumor ROI for patients 2 (top row), 9 (middle row), and 8 (bottom row). Whole head and neck region is shown on left, tumor ROI in center, and both regions on right. ● = whole head and neck region; red triangles = putative hypoxic tumor region; green squares = putative normoxic tumor region.

