Figure 6.
Suppressive Effect of Loss-of-Function Mutations in VPS35 Paralogs.
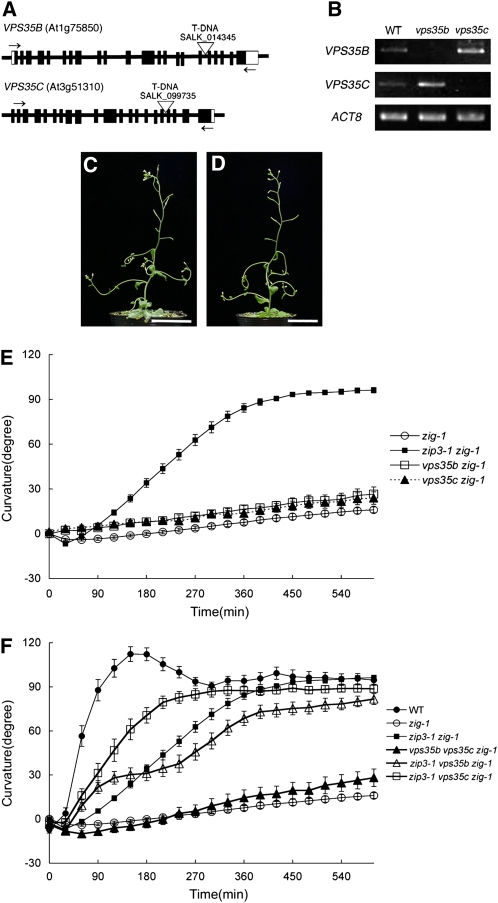
(A) Schematic structures of VPS35B and VPS35C genes and positions of T-DNA insertions. Boxes indicate exons, and white regions represent untranslated regions. Open triangles show positions of T-DNA insertions. Arrows indicate the position of primers used for RT-PCR analyses to detect expression of VPS35B or VPS35C in (B).
(B) RT-PCR analysis to detect expression of VPS35B or VPS35C in wild-type and mutant plants using the primers indicated by arrows in (A).
(C) and (D) Morphological phenotypes of 6-week-old plants of vps35b zig-1 (C) and vps35c zig-1 (D). Bars = 3 cm.
(E) Gravitropic response of zip3-1 zig-1 (closed squares), zig-1 (open circles), vps35b zig-1 (open squares), and vps35c zig-1 (closed triangles). At least 15 individuals of each genotype were examined. Bars represent se.
(F) Gravitropic response of wild-type (closed circles), zip3-1 zig-1 (closed squares), zig-1 (open circles), zip3-1 vps35b zig-1 (open triangles), zip3-1 vps35c zig-1 (open squares), and vps35b vps35c zig-1 (closed triangles). At least 15 individuals of each genotype were examined. Bars represent se.
[See online article for color version of this figure.]

