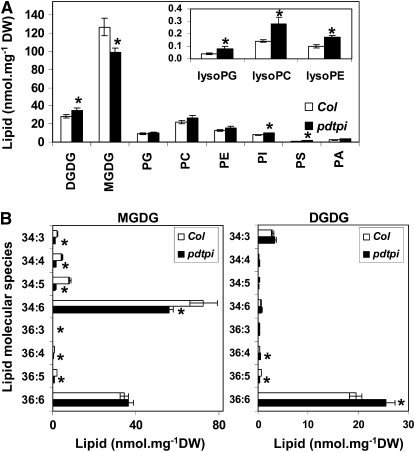
Figure 7.
Downregulation of pdTPI Alters the Lipid Composition of Chloroplast Membranes.
Lipids were isolated from 5-d-old seedlings grown on MS plates and were analyzed by lipidomic profiling. Data are presented as the mean ± se from four biological replicates. Values marked with asterisks were determined to be significantly different from wild-type values by t test; the P values for total lipid in (A) are 0.048 (DGDG), 0.036 (MGDG), 0.33 (phosphatidyglycerol), 0.12 (phosphatidycholine), 0.096 (phosphatidylethanolamine), 0.020 (phosphatidylinositol), 0.014 (phosphatidylserine), 0.091 (phosphatidic acid), 0.021 (lysoPG), 0.015 (lysoPC), 0.0028 (lysoPE). The P values for MGDG in (B), left panel, are 0.0014 (34:3), 0.00044 (34:4), 0.00056 (34:5), 0.050 (34:6), 0.015 (36:3), 0.0015 (36:4), 0.00036 (36:5), and 0.26 (36:6). The P values for DGDG in (B), right panel, are 0.12 (34:3), 0.12 (34:4), 0.092 (34:5), 0.24 (34:6), 0.22 (36:3), 0.029 (36:4), 0.0042 (36:5), and 0.018 (36:6).
(A) Total glycerolipids in leaves of the wild-type (Col; open bars) and the pdtpi mutant (closed bars).
(B) Acyl composition of major chloroplast lipids MGDG (left panel) and DGDG (right panel).

