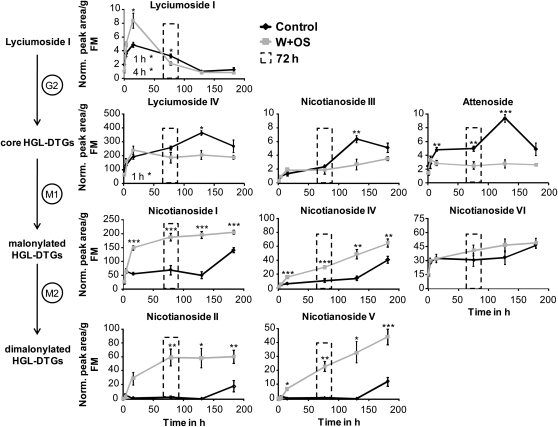
Figure 4.
The Different Biosynthetic Groups of HGL-DTGs Display Characteristic Dynamic Patterns over 1 Week of Growth in Rosette-Stage Plants.
Plants were left unelicited (Control), or five leaves per plant were elicited with W+OS. Elicited leaf positions were harvested and pooled from each plant (one pooled sample per plant, n = 5) at one of five time points: 1, 4, and 14 h (night), and 3, 5, and 7 d. The precursor lyciumoside I (average + se) attains maximum concentration during the night at 14 h and then decreases as other compounds accumulate. In W+OS-elicited leaves, the sharp decline in precursor levels following their 14 h peak likely supply substrates for the subsequent accumulation of core compounds, which do not peak, but are maintained at a constant level as they provide substrate for the synthesis of malonylated compounds. The elevation in malonylated compounds begins concurrently with the elevation in core compounds and precursor levels in W+OS-elicited leaves, but at 7 d in unelicited leaves. All compounds reach stable elicited levels beginning at 3 d after W+OS elicitation (indicated by the dotted rectangle) with the exception of malonylated compounds derived from nicotianoside III, which continue to increase. Note that scales change among graphs. Asterisks indicate significant differences between W+OS-treated and control samples in Student's t tests within each time point (*P ≤ 0.05, ** P < 0.01, and *** P < 0.001).

