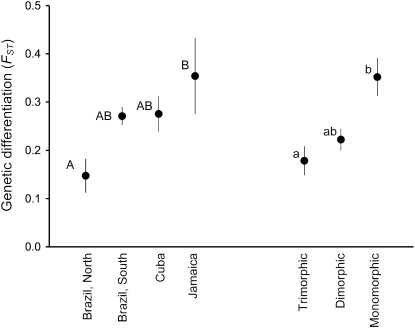
Figure 6.—
Mean Fst for pairwise population comparisons of Eichhornia paniculata within geographical regions. The values were averaged across populations within each of the four regions and also for trimorphic, dimorphic, and monomorphic populations. Letters indicate significant differences using the Tukey–Kramer HSD test. Error bars represent ±1 SE.

