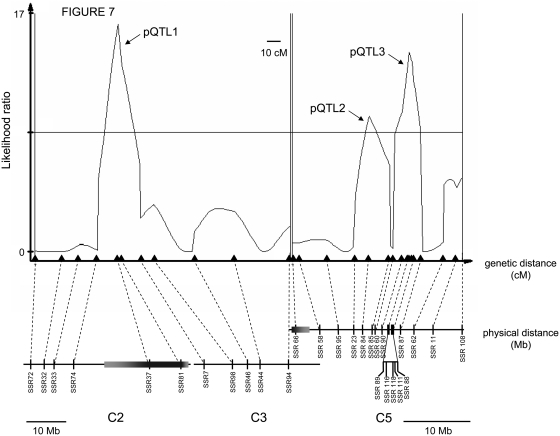
Figure 7.—
Genetic dissection of the effect of chromosomes 2, 3, and 5 on progeny number from D. virilis–D. americana crosses. Likelihood ratio (LR) test statistic profile from composite interval mapping of progeny number in the D. americana–backcross male mapping population. A horizontal line marks the LR significance threshold of 8.5. The genetic positions of molecular markers are indicated by triangles, and the corresponding physical locations along chromosomes 2, 3, and 5 (based on the D. virilis genome assembly) are indicated below by vertical bars. Shaded horizontal bars on chromosomes 2 and 5 denote inverted regions, with lighter shading representing uncertainty in precise physical position. Note that physical distances for chromosomes 2–3 and 5 are shown at different scales.

