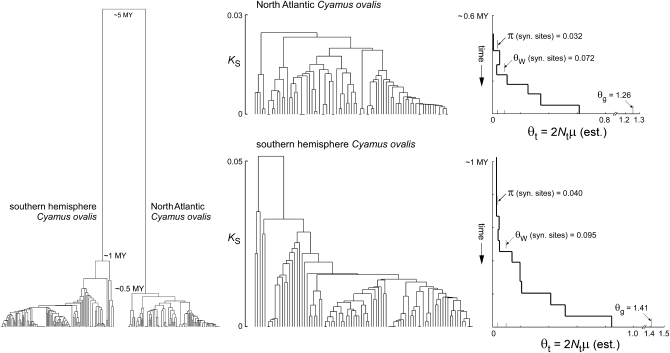
Figure 1.—
Mitochondrial gene genealogies for North Atlantic and southern hemisphere Cyamus ovalis, estimated by UPGMA from partial COI sequences. Left: The intraspecific genealogies coalesce globally at ∼0.5 and 1 MY and share an ancestor at ∼5 MY (Kaliszewska et al. 2005). Center and right: Each intraspecific genealogy is aligned with a generalized skyline plot (Strimmer and Pybus 2001) showing estimates of θ at different times in the past under a piecewise constant model of population size change fit by GENIE 3.0 (Pybus and Rambaut 2002). Three different point estimates of present-day θ are also indicated on the plots (synonymous-site nucleotide diversity π, Watterson's θ estimated from synonymous sites, and θ estimated jointly with the apparent exponential growth rate by the MCMC coalescent algorithm in LAMARC). Values of Tajima's D are lower (−1.5 to −1.6) when estimated from the sequences than when estimated from the branch lengths of the trees (−2.1 to −2.4), as expected because multiple substitutions occur at some sites. Similar values of DT (−2.3 for both species) were obtained from the highest-likelihood trees found by BEAST with a fully parameterized GTR substitution model and a coalescent prior. Those trees have standardized imbalance statistics (−IS) of −3.7 (southern hemisphere C. ovalis) and −2.2 (North Atlantic C. ovalis). The trees shown here have more extreme values of −IS (−5.5 and −4.0, respectively), probably as a consequence of artificially pectinate branching orders induced by UPGMA among sets of identical sequences. Slightly different sets of sequences were used to make the two-species genealogy on the left and the single-species genealogies in the center. The long interspecific branches in the two-species tree are based on a multispecies maximum-likelihood analysis involving smaller numbers of much longer (4.1 kb) sequences (Kaliszewskaet al. 2005, Figure 3).

