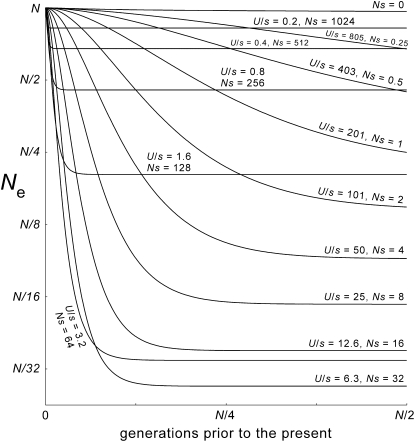
Figure 4.—
Apparent average effective sizes of ancestral populations, for models with different values of s. Values of Ne are given on the vertical axis (logarithmically scaled). They are estimated from the variance of expected contributions to the present, for the adults of any given generation. The parameters are those of Figure 2 (N = 65,536 = “64k,” μ = 1.5 × 10⁻⁶, Ls = 2048, U = 0.0031). In theory the curve for s = 0 should be perfectly horizontal. The discrepancy appears to be caused by subtle flaws in the shape of the very broad “idealized” simulated distribution that was used in this calculation. The curves for strong-selection cases are perfectly horizontal at times beyond a few thousand generations because the mutation-number distributions are compact, with little stochastic variation. The two lowest curves are those for the selection coefficients (s = 2−10, U/s = 3.2, and s = 2−11, U/s = 6.3) that produce the most extreme values of the polymorphism and tree-shape statistics, given the other parameters (Figure 2).

