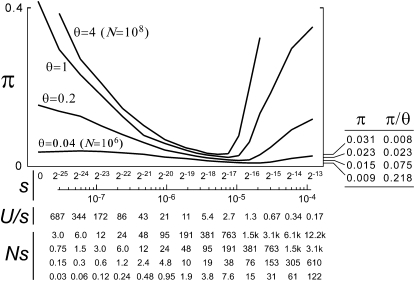
Figure 5.—
Average neutral nucleotide diversities (πn) as functions of the selection coefficient (s) for models with a realistically low mutation rate (μ = 2 × 10⁻⁸), 2048 selected sites, and a range of realistically large population sizes. Four Ns scales are shown at the bottom, corresponding to the curves for N = 108 (θ = 4) down to N = 106 (θ = 0.04), respectively.

