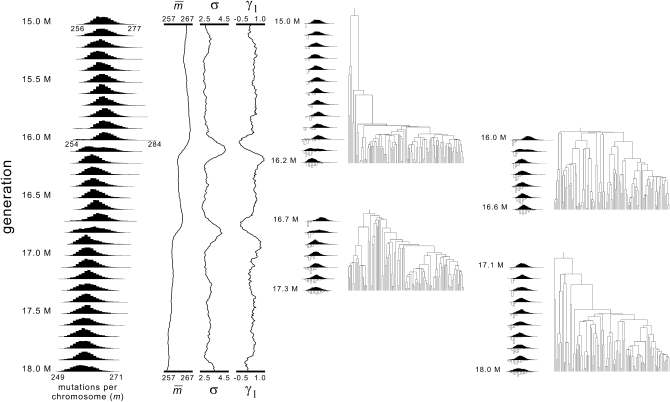
Figure 6.—
Mutation-number distributions and genealogies during pseudoadaptive sweeps. The history depicted covers 3 million generations (from 15 million to 18 million, from a total of 100 million) in a simulation where N = 2.5 × 10⁷, μ = 2 × 10⁻⁸, Ls = 2048, and s = 2−18 (one of the cases used to draw the curve for θ = 1 in Figure 4). The population's mutation-number distributions are shown on the left, at intervals of 0.1 million generations. Continuous histories of the mean, standard deviation, and skewness statistics are shown in the center. Genealogies sampled at generations 16.2, 16.6, 17.3, and 18 million are shown on the right, with miniaturized versions of the population's mutation-number distributions (solid histograms, above) and the sample's distributions (open histograms, below). The first of two “mini-pseudo-adaptive sweeps” begins at ∼15.9 million, continues through 16 and 16.1 million, and is finished by 16.2 million. The genealogy sampled at 16.2 million passes through it and shows highly accelerated rates of coalescence during the event. The genealogy sampled later (at 16.6 million) is cut off by the event, because all of the sample's lineages have reached the thin lower (left) tail of the population's mutation-number distribution by 16 million. The next genealogy (17.3 million) is shortened in a similar way by the second sweep that occurs at roughly 16.7–16.9 million. The fourth genealogy (18 million) is more typical of those that occur under these parameters (most take >1 million generations to coalesce globally). Conspicuous sweeps do not typically occur as often as illustrated here, under these parameters, but the genealogies are typical of ones sampled at these four times, from this particular history.

