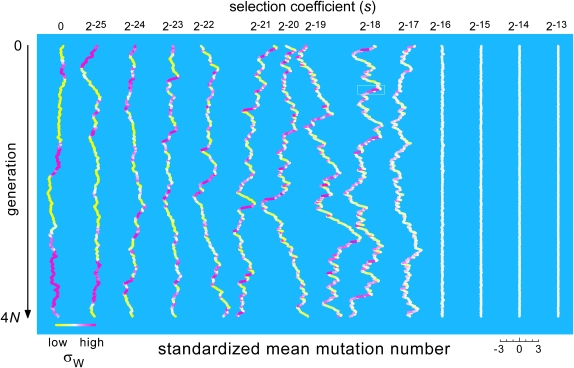
Figure 7.—
Dynamics of fitness as a function of s. Each trace shows the population's mean mutation number (as deviations from its long-term mean, in units of the average within-generation standard deviation) over all 100 million generations of the run that was used to generate a point on the curve for θ = 1 in Figure 4. The within-generation standard deviations decrease monotonically with s, from 15.4 for s = 0 and 10.0 for s = 2−25 to 0.6 for s = 2−13. Thus the mean wanders much more widely, both absolutely and relatively, for cases in the intermediate-selection regime than for ones in the strong-selection regime, and it is also less stable (at least relatively) than for cases in the weak-selection regime. The traces are centered horizontally at intervals of six standard deviations; this scaling is shown explicitly for s = 2−14. The greatest range of relative mean mutation numbers (from −4.7 to +5.3 standard deviations) occurs where s = 2−19. Time flows from top to bottom. The mean mutation number is decreasing when a trace moves to the left and increasing when a trace moves to the right. Rapid, sustained decreases of the mean occur frequently in the intermediate-selection regime (s = 2−21–2−17), always in conjunction with an above-average variance of mutation number and hence of fitness. The color scale shows the population's current standard deviation of mutation number and fitness relative to its long-term mean; solid yellow indicates a standard deviation ≥37% below the long-term mean, and solid magenta indicates a standard deviation ≥58% above the mean. Figure 6 gives a high-resolution view of a small segment of the trace for s = 2−18 (boxed), during which fitness improves substantially, but at rates that also vary substantially.

