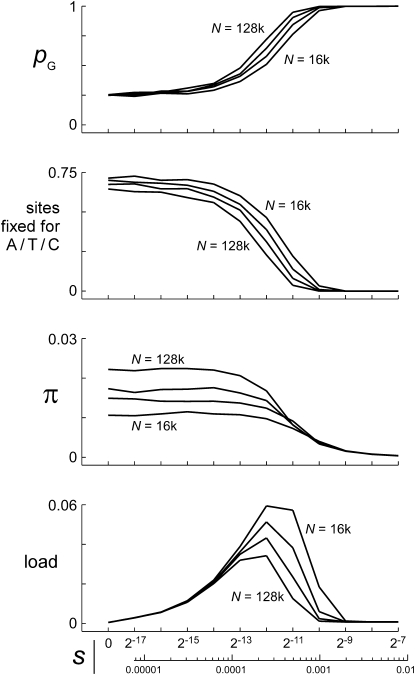
Figure 8.—
Statistics for chromosomal blocks with different values of s under model II. The chromosome has 11 blocks of 512 sites subject to mutations with effect sizes of s = 2−17–2−7 in a doubling series, plus a large number of neutral sites. The mutation rate is the same as in Figure 2, so Us ≈ 0.0008 for each block. The model was run as a forward simulation for population sizes of N = 214 (16k) through 217 (128k) or θ = 0.05, 0.1, 0.2, and 0.4. Each panel displays curves for these four different population sizes. The top panel shows blockwise average frequencies of the fittest nucleotide state (arbitrarily defined as G for “good”), and the second panel shows average proportions of sites fixed for non-G. The third panel shows average nucleotide diversity in each block, and the bottom panel shows the contribution made by each block to the total mutational load. At all four population sizes, mutations of severity s = 2−12 = 0.00024 (Us/s = 3.15) make the largest contribution, and most of the load is generated by the blocks for which Us/s = 1.6–12.6.

