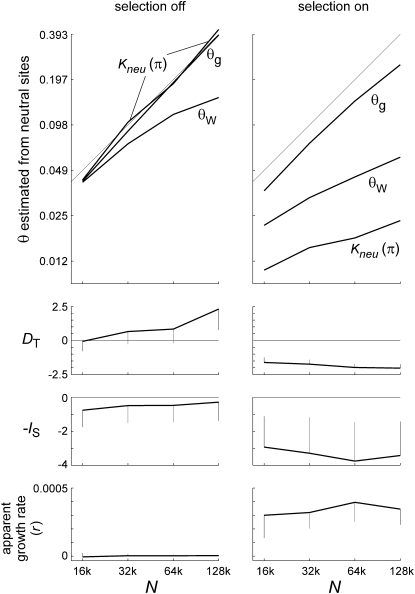
Figure 9.—
Estimates of θ and tree shape for model II. Panels on the left show control runs where s = 0 in all blocks; panels on the right show the experimental runs of Figure 8. Curves in the top panels show mean values of three estimators of θ (nucleotide diversity at neutral sites with correction for multiple substitutions, Watterson's θ at neutral sites, and θg from the tree-based exponential growth model) as functions of N. The 45° lines show true values of θ. Corrected πn and θg both perform nearly perfectly with selection turned off, while θW increasingly underestimates θ as N increases, owing to multiple hits. With selection turned on, θg slightly underestimates θ, while Watterson's estimator and especially πn severely underestimate θ. Both increase as N increases, but not proportionally. Tajima's D becomes strongly negative, with reduced variation (second panels from top), while −IS becomes strongly negative with increased variation (third panels from top) when selection is turned on, and neither statistic is much affected by N. The apparent growth rate (bottom panels) is zero with selection turned off, but it averages 0.0003–4 with selection turned on, consistent with the intermediate values of s that contribute most to the load. Error bars are standard deviations of the statistics, over samples within a run.

