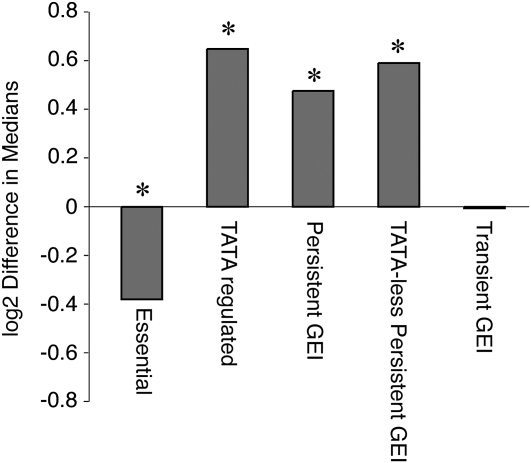
Figure 3.—
Genes affected by GEI show different levels of purifying selection. The log2 difference in the median Vg/Vm was measured for each indicated group vs. all remaining genes analyzed. Negative values indicate smaller ratios and positive values represent larger ratios than the comparison group. TATA-less persistent-GEI genes were scored against all remaining TATA-less genes. Statistically significant differences (P < 0.05, Wilcoxon's rank-sum test) are indicated with an asterisk. See text for P-values.

