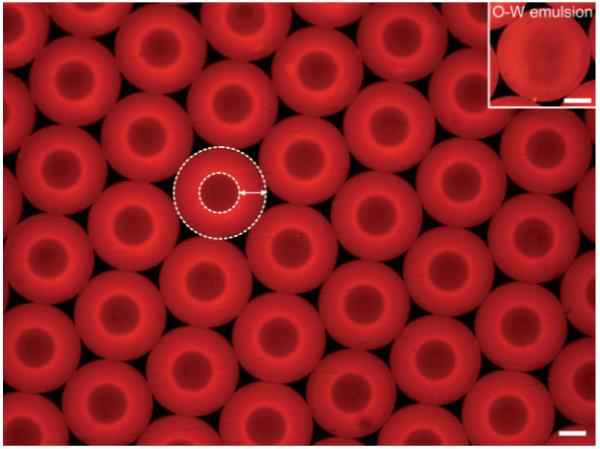
Figure 2.

Fluorescence microscopy image of uniform W-O-W emulsions fabricated using the fluidic device. The emulsions with an aqueous interior (dark red) surrounded by the PLGA solution (red) in DCM were dispersed in the continuous water phase (black). In this case, rhodamine 6G (a hydrophobic dye) was added to the oil phase as a fluorescence probe. The flow rates for the inner water phase, middle oil phase, and outer water phase were 0.03, 0.3, and 2 mL min-1, respectively. The arrow indicates the middle oil phase and the white dotted lines indicate the boundaries between the phases. The inset depicts O-W emulsion for comparison to W-O-W emulsion. The scale bars are 200 μm.
