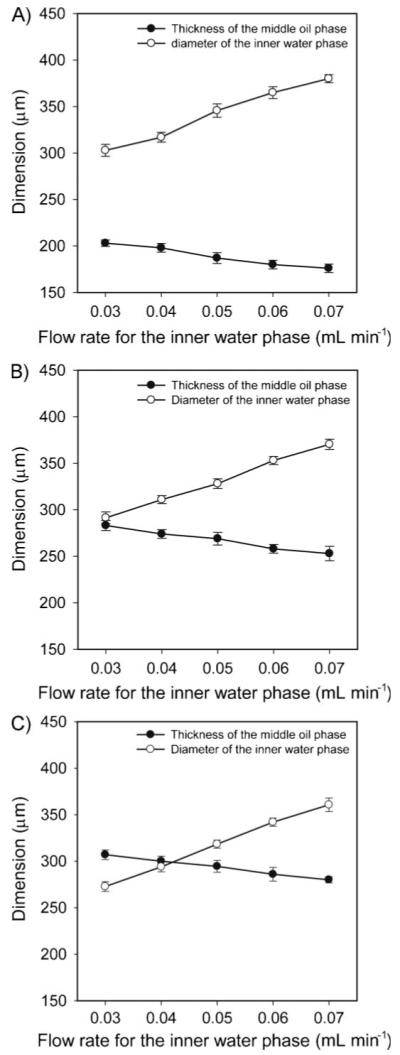
Figure 3.

Effects of the flow rate of each phase on the average diameter (d) of the inner water droplet and thickness (t) of the middle oil phase in the W-O-W system. The flow rates for the middle oil phase were A) 0.3, B) 0.4, and C) 0.5 mL min-1. The flow rate for the outer water phase was kept at 2 mL min-1.
