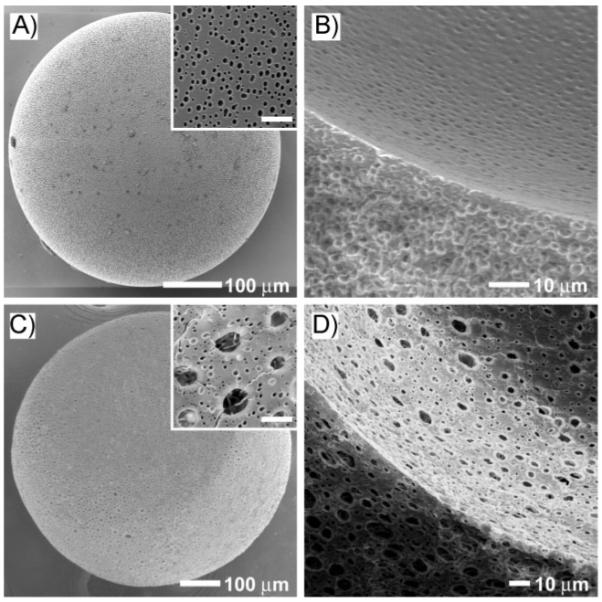
Figure 5.

SEM images of PLGA microbeads with hollow interiors and porous walls prepared by the A,B) W-O-W method and C,D) W-W/O-W method, respectively. The outer surfaces of the microbeads are shown in (A) and (C), while the cross sections and the inner surfaces are shown in (B) and (D). The flow rates of the inner water, middle oil, and outer water phase were 0.03, 0.3, 2 mL min-1, respectively, for the W-O-W method, and 0.035, 0.3, and 2.5 mL min-1, respectively, for the W-W/O-W method. The insets in (A) and (C) are high magnifications of the outer surfaces of the microbeads, where the scale bars are 5 μm.
