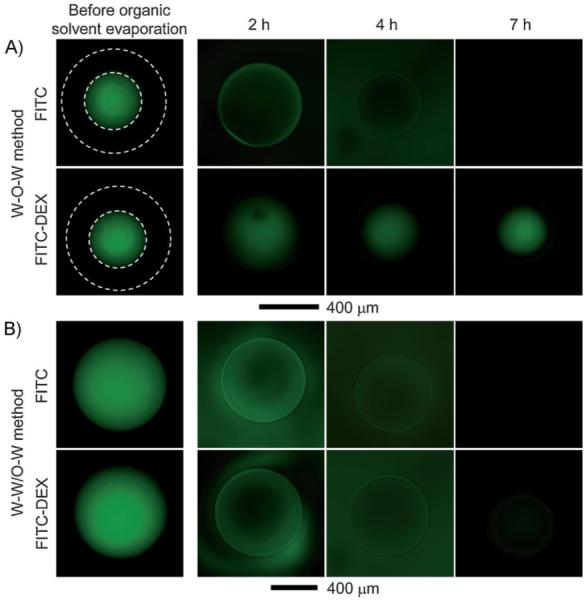
Figure 7.

Fluorescence microscopy images of PLGA microbeads fabricated using the A) W-O-W and B) W-W/O-W method, respectively, as a function of time. After the resultant emulsions were collected with a glass Petri dish, images were taken at 2, 4, and 7 h while the solvent was removed by evaporation. FITC (Mw ≈ 389) and FITC-dextran (Mw ≈ 20 000) were used as probes by adding them into the inner water phase to evaluate the size and interconnectivity of the pores. The white dotted lines indicate the outer surface of the microbeads.
