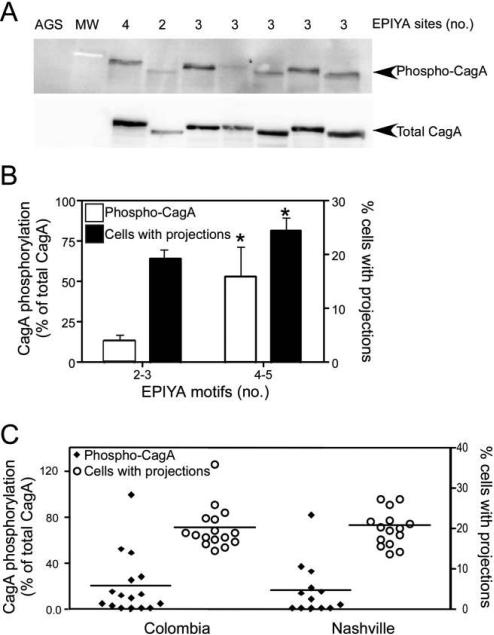
Figure 1.
Relationship between EPIYA motif number, CagA phosphorylation, and epithelial cell morphology. A, AGS cells were cocultured with Helicobacter pylori cag–positive strains, and cell lysates were harvested and subjected to Western blot analysis using an anti–phosphotyrosine antibody or an anti-CagA antibody. A representative blot is shown. AGS, cells incubated with medium alone. B, Levels of CagA phosphorylation and epithelial morphologic aberrations induced by H. pylori, segregated by EPIYA motif number. Left axis, densitometric analysis of multiple Western blot repetitions performed on at least 2 occasions per strain. Levels of phospho-CagA were normalized to total CagA. Right axis, the number of cells with cytoskeletal projections was normalized to the total number of cells counted. H. pylori strains were stratified by number of CagA EPIYA motifs as determined by sequencing. Error bars, SEM. *P < .05 for comparison of strains with 4–5 EPIYA motifs versus those with 2–3 EPIYA motifs for both level of CagA phosphorylation (white columns) and the percentage of cells with projections (black columns). C, Levels of CagA phosphorylation (left axis) and epithelial morphologic abnormalities (right axis) induced by H. pylori, stratified by geographic region of origin. Mean values are shown within scatterplots.

